English
 Español
 Français
 Deutsch
 Italiano
 Português

Design, in the popular imagination, belongs to the realm of aesthetics, a discipline governed by taste, intuition, and creative vision. Mathematics, by contrast, is understood as rigorous, abstract, and universal. Yet this perceived opposition dissolves under examination. Every typeface is a system of geometric relationships; every logo a topology of meaning; every urban grid a spatial algebra; every colour palette a mapping of perceptual mathematics onto cultural semiotics. The relationship between mathematics and design is not incidental or metaphorical; it is structural, operating at the level of form, proportion, pattern, and logic. This article explores that relationship across several dimensions: the geometry of proportion, the mathematics of semiotics, the algebraic logic of grid systems, information theory in visual communication, and the topological imagination in contemporary design.
The intersection is not merely theoretical. The global design industry was valued at approximately USD 422 billion in 2022 and is projected to exceed USD 755 billion by 2032 (Grand View Research, 2023). Mathematical literacy is increasingly recognised as a design competency, from computational design and parametric architecture to data visualisation and algorithmic typography. Understanding the mathematical substrate of design is, therefore, both an intellectual and professional imperative.
The geometry of proportion: from Vitruvius to the golden ratio
The search for a mathematical basis for beauty in design is ancient. Vitruvius, the first-century BCE Roman architect, articulated three principles of architecture, firmitas (solidity), utilitas (utility), and venustas (beauty), arguing that proportion and geometry were the foundations of the third. His treatise De Architectura describes how the proportions of the ideal human body, a system he inherited from Greek sculptural tradition, could be translated into architectural form. The Vitruvian Man, later famously illustrated by Leonardo da Vinci circa 1490, is as much a mathematical diagram as an artistic one: it inscribes the human figure within both a circle and a square, suggesting that the same geometric principles govern bodily and spatial form.
The most enduring mathematical concept in design proportion is the golden ratio, denoted by the Greek letter 'phi' (φ), approximately equal to 1.6180339887. The golden ratio is defined by the property that the ratio of the whole to the larger part equals the ratio of the larger part to the smaller part. Formally: if a > b > 0, then (a + b)/a = a/b = φ. This ratio is intimately connected to the Fibonacci sequence, the series 1, 1, 2, 3, 5, 8, 13, 21, 34, 55..., in which each term is the sum of the two preceding ones. The ratio of successive Fibonacci numbers converges rapidly on φ: 34/21 ≈ 1.619 and 55/34 ≈ 1.618, with increasing precision as the sequence progresses.
Claims about the prevalence of the golden ratio in classical art and architecture have been somewhat overstated; careful measurement of the Parthenon and other monuments claimed to embody φ reveals significant deviations (Markowsky, 1992). Nevertheless, the ratio does appear extensively in natural forms: the logarithmic spiral of nautilus shells, the arrangement of florets in sunflowers, the branching of trees, and the spiral structure of galaxies all approximate φ-based geometries. Whether by direct knowledge or by intuitive pattern recognition, designers across cultures have incorporated these proportions, the most famous contemporary example being the Apple logo, which its designers have documented as constructed using circles whose sizes follow Fibonacci proportions (Lindgaard et al., 2011).
Grid theory: Algebra in spatial organisation
The typographic grid, a system of invisible geometric guides used to organise text, images, and white space on a page or screen, is one of the most directly mathematical tools in design. The Swiss typographer Josef Müller-Brockmann, whose 1961 book Grid Systems in Graphic Design became canonical, articulated the grid not merely as a visual convenience but as a logical structure rooted in rational organisation: 'The grid system is an aid, not a guarantee. It permits a number of possible uses, and each designer can look for a solution appropriate to his personal style. But one must learn how to use the grid; it is an art that requires practice.'
A grid is mathematically defined by at least four variables: the number of columns (n), the column width (c), the gutter width (g), and the margin width (m). In a standard typographic grid, if the total content width is W, then W = n·c + (n-1). ·g. This is a linear Diophantine equation when n, c, and g are constrained to integer or rational values by printing constraints. Grid design therefore involves solving a system of linear equations while satisfying multiple inequality constraints, a task that, in complex publications like newspapers or web design systems, requires the designer to operate as a spatial algebraist.
The baseline grid, the horizontal rhythm that governs line spacing and element alignment, adds a second dimension of mathematical structure. The baseline unit (typically equal to the leading, or line height) creates a vertical modular system. Elements are placed at integer multiples of this baseline unit, ensuring visual rhythm and harmonic proportion across the page. This is essentially a form of modular arithmetic applied to spatial design.
Contemporary web design has formalised this mathematical structure through CSS Grid and Flexbox specifications, which implement a coordinate geometry system in the browser. The CSS Grid Layout specification defines a two-dimensional grid system using fractional units (fr), which distribute remaining space proportionally, a direct application of ratio and proportion mathematics. Responsive design systems like Bootstrap and Tailwind CSS use a 12-column grid, chosen because 12 is divisible by 1, 2, 3, 4, and 6, providing maximum flexibility in column combinations, a number-theoretic decision with profound implications for layout flexibility.
Semiotics as mathematical structure: Peirce's triadic logic
The discipline of semiotics, the study of signs and meaning, provides a powerful framework for understanding how design communicates. Charles Sanders Peirce, the 19th-century American philosopher and mathematician, developed a triadic model of the sign that can be expressed in quasi-mathematical terms. For Peirce, a sign (representamen) relates to its object through the mediation of an interpretant, the thought or meaning generated in the mind of the sign's receiver. This triadic relationship can be formalised: Sign = f(Representamen, Object, Interpretant), where f denotes a function of interpretation that varies with context and cultural code.
Peirce further classified signs into three fundamental categories that align remarkably with the mathematical notions of identity, resemblance, and convention. An icon maintains a relationship of resemblance or structural similarity with its object, as a mathematical graph visually resembles the data it represents. An index bears a causal or existential relationship with its object, as smoke indexes fire, or a pointing arrow indexes direction. A symbol bears an arbitrary, conventional relationship with its object, as the letter 'A' has no structural connection to the phoneme it represents beyond the convention established by alphabetic tradition (Peirce, 1931-1935).
This tripartite system is not merely taxonomic; it generates a mathematical logic of sign combination. Complex signs combine iconic, indexic, and symbolic elements in determinate proportions. A logo for a tech company might use an abstract geometric form (largely symbolic), with an icon suggesting speed or connectivity (partly iconic), placed in a brand context that signals corporate identity (indexic in its reference to the company's track record). Analysing design through Peirce's framework is, in effect, performing a kind of semiotic algebra, decomposing complex communicative structures into their elementary sign-relations.
Information theory and visual design
Claude Shannon's mathematical theory of communication (1948), originally developed to maximise the efficiency of electronic message transmission, has profound implications for visual design. Shannon defined information content in terms of entropy: H = -Σ p(x) log₂ p(x), where p(x) represents the probability of each possible message symbol. High entropy corresponds to high information content (unpredictability); low entropy corresponds to redundancy and predictability. This mathematical relationship maps onto visual design in illuminating ways.
In typography, readability research has long established that familiar letterforms, those with high redundancy relative to reader expectations, are processed faster than novel or distorted ones. The Gestalt principles of visual perception (proximity, similarity, continuity, closure, and figure-ground) can be restated in information-theoretic terms: these principles describe the cognitive compression algorithms the visual system applies to incoming visual data, reducing information load by predicting patterns. Good typographic design exploits redundancy (consistency, rhythm, familiar conventions) to reduce cognitive load while using strategic entropy (surprise, contrast, disruption of expectation) to direct attention.
Data visualisation, among the most directly mathematical domains of design, is essentially the application of statistical and information-theoretic principles to visual form. Edward Tufte's concept of data-ink ratio (the proportion of ink in a visualisation that encodes data, rather than decoration) is a direct application of Shannon's efficiency principle: maximise information per pixel and minimise chartjunk (Tufte, 1983). The field has since formalised around perceptual channels, colour hue, position, size, and angle, ranked by their capacity to encode quantitative information accurately, based on Cleveland and McGill's (1984) landmark psychophysical studies on graphical perception.
Topology and the design of form
Topology, the branch of mathematics concerned with properties of geometric objects that are preserved under continuous deformation (stretching, bending, and twisting, but not tearing or glueing), has become an increasingly important conceptual resource for design theory. In topology, a coffee mug and a doughnut are equivalent (homeomorphic) because each has exactly one hole; their surfaces can be continuously deformed into one another. What topology preserves is not metric properties (distance, angle, size) but structural ones (connectedness, continuity, boundary).
This topological imagination is directly relevant to logo design and identity systems. A successful logo must remain recognisable across a range of transformations: colour inversions, size changes, material translations (embroidery, sandblasting, neon signs), and reproduction methods (screen, print, engraving). Designers intuitively seek topological robustness, maintaining the sign's structural identity across transformations. The Nike Swoosh, the Apple apple, and the Mercedes star are all topologically simple forms that survive these transformations because their defining characteristics are structural (the overall curve, the bite, and the three-pointed symmetry) rather than metric.
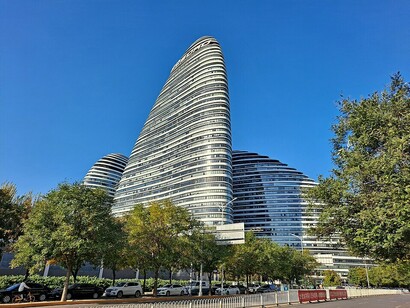
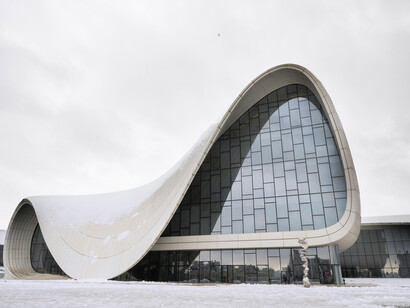
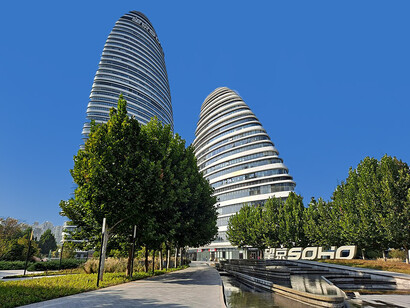
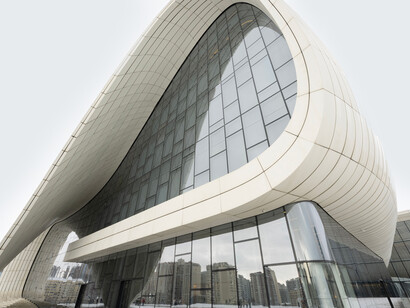
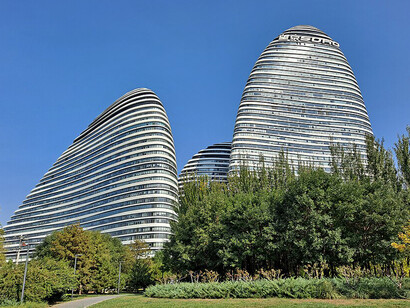
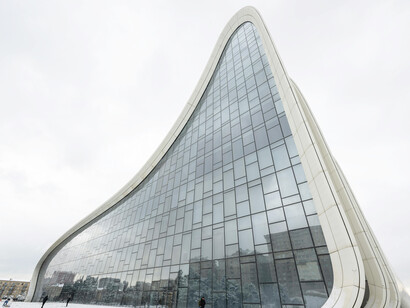
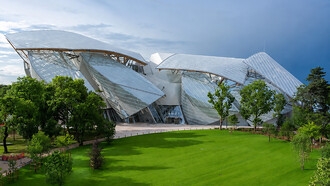
In parametric architecture, a design generated through computational algorithms with variable parameters, topology becomes explicit. Architects like Zaha Hadid and Greg Lynn and firms like BIG (Bjarke Ingels Group) use topological surfaces (NURBS, Non-Uniform Rational B-Splines) to generate building forms that cannot be described by conventional Euclidean geometry. The Heydar Aliyev Centre in Baku, designed by Zaha Hadid Architects, is a continuous surface with no hard edges; its form is topologically akin to a Klein bottle fragment. This architecture is not metaphorically mathematical; it is literally generated by equations.
Colour mathematics and chromatic design
Colour in design is a deeply mathematical domain. The representation of colour in digital systems requires three-dimensional coordinate spaces: the RGB model defines colour as a point in a cube of dimension 255³ (approximately 16.7 million distinct colours); the HSL (Hue, Saturation, Lightness) model represents colour as a point in a cylinder, providing a more perceptually intuitive coordinate system; and the CMYK model (Cyan, Magenta, Yellow, Black) uses a four-dimensional subtractive colour space used in print. Converting between these spaces requires linear algebra, matrix multiplication and transformation.
Colour theory's concept of complementary colours (colours opposite each other on the colour wheel) has a direct mathematical basis: in the HSL model, complementary colours are separated by exactly 180° of hue rotation. Triadic colour harmonies (three colours equally spaced on the colour wheel) are separated by 120°, the vertices of an equilateral triangle inscribed in the hue circle. Colour contrast ratios, standardised in the Web Content Accessibility Guidelines (WCAG) as a minimum of 4.5:1 for normal text (W3C, 2023), are calculated using the relative luminance formula, a non-linear function of RGB values derived from the CIE 1931 colour space model.
Conclusion
The mathematical substrate of design is not a modern discovery; it runs through the entire history of human visual culture, from the geometric decoration of Indus Valley pottery to the algorithmic architecture of contemporary parametric design. What has changed is the degree to which this mathematical foundation has become explicit, formalised, and programmable. The designer of the 21st century operates simultaneously as mathematician, semiotician, and visual communicator, whether or not they articulate their practice in these terms.
Recognising this mathematical substrate does not demystify design or reduce it to calculation. The golden ratio does not automatically produce beauty; grid systems do not guarantee good layout; topological robustness does not make a logo meaningful. Mathematics provides structure; design provides meaning. The relationship between them is what generates the richest forms of visual communication, structured enough to be coherent, flexible enough to be surprising, and mathematical enough to be understood.
References
Grand View Research. (2023). Design services market size, share & trends analysis report. Grand View Research.
Markowsky, G. (1992). Misconceptions about the golden ratio. The College Mathematics Journal, 23(1), 2–19.
Peirce, C. S. (1931–1935). Collected papers of Charles Sanders Peirce. Harvard University Press.
Shannon, C. E. (1948). A mathematical theory of communication. Bell System Technical Journal, 27(3), 379–423.
Tufte, E. R. (1983). The visual display of quantitative information. Graphics Press.
Cleveland, W. S., & McGill, R. (1984). Graphical perception: Theory, experimentation, and application to the development of graphical methods. Journal of the American Statistical Association, 79(387), 531–554.
Müller-Brockmann, J. (1961). Grid systems in graphic design. Niggli Verlag.
W3C. (2023). Web content accessibility guidelines (WCAG) 2.2. World Wide Web Consortium.