English
 Español
 Français
 Deutsch
 Italiano
 Português
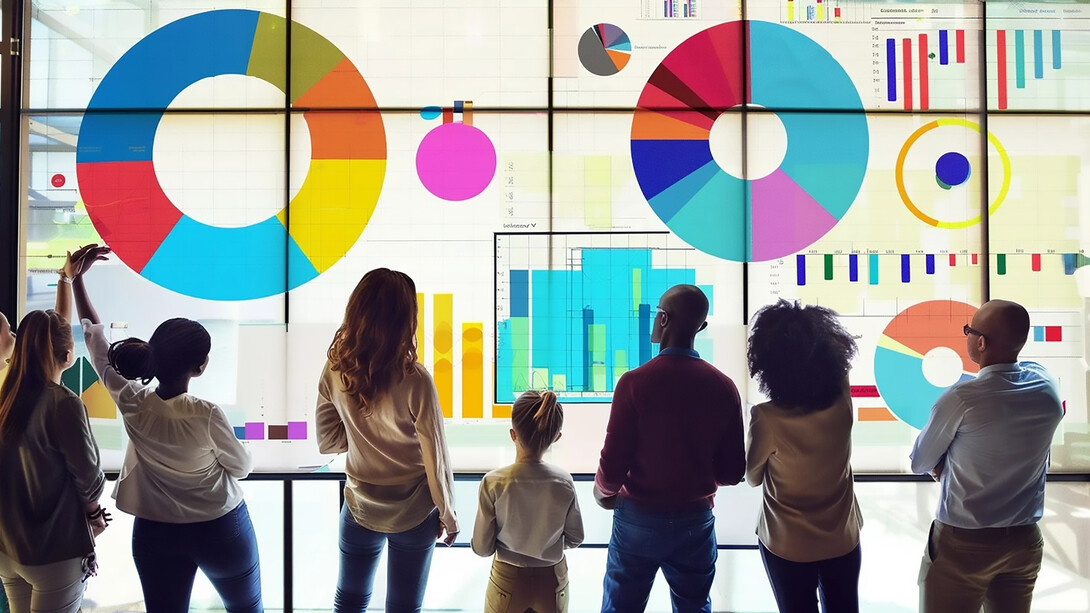
Among their various goals, brands primarily aim to share a message they desire that aligns with their identity and values while effectively reaching their target audience. Their ultimate objective is to attract as many consumers as possible and establish a strong connection with them. For that reason, the message should be presented appealingly and memorably. The best way, so, to present a message in today's digital era is through the visualization of data each company wants to show the public. Advertisements on social media, in the general internet sphere, and the real world inform the audience each brand targets about the message by presenting a story made by data1.
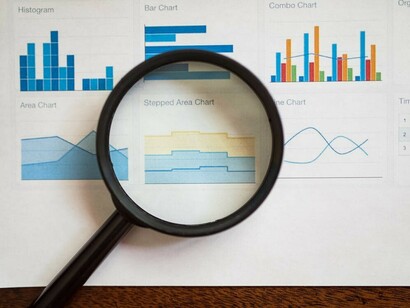
The story is the context in which the message is shared with the audience. The products or services of each type can serve as the brand's message. This data storytelling method can be enhanced by utilizing graphic design tools that transform computational advertisements of either products or services into vivid, colorful visualizations that closely resemble human figures’ standards. The so-called infographics, namely these mentioned graphic design tools, contain plenty of data presenting applications, such as bar charts, histograms, bubble graphs, and pies. They are all used to best interpret the available data to make the brand message obvious and non-forgettable to the public.
In detail, to create appealing and effective digital graphic designs, a data scientist should consider three key factors. Firstly, they must focus on the content (message) to ensure that the information being conveyed is clear and engaging. Secondly, the structure of the design (how data will be arranged to present the message) is crucial, as a well-organized layout enhances comprehension. Lastly, formatting (how mainly AI-generated tools will be used to succeed in the previously mentioned goal) plays a vital role, as AI technologies help refine visuals and automate design elements. By balancing these aspects, digital graphic designs become both visually attractive and highly functional 2.
To be more precise, the formatting refers to the digital designing area, the shapes, the colors, and their volume, which communicate the actual message. Shapes include scatterplots, line charts, etc. Concerning the colors, there are a lot of digital tools for developing the initial design, such as the Color Brewer, the Coblis Simulator, and the Paletton tool. Testing the colors and the application of each tool is a crucial step in the creation process before finalizing their use in the project. Fonts, axes, and scales need to be tested as well. Except for the available apps and online tools, there is also the option of utilizing either a programming language, like R and Python, or popular software applications, like Tableau, Excel, and Google Sheets, to transform the data into a visual message.
Artificial Intelligence applications, such as ChatGPT, play a significant role in enhancing both data visualization and graphic design. These AI-powered tools can accelerate the process of writing complex data visualization code, making it easier for users to generate insightful and interactive charts, graphs, and other representations of datasets.
Additionally, AI contributes to enriching graphic design by incorporating advanced features such as 3D modeling, dynamic animations and real-time modifications, allowing for more visually appealing and engaging content. This technological advancement improves efficiency in data representation and, fosters creativity and accessibility for individuals who work with or modify datasets. By streamlining workflows and automating repetitive tasks, AI allows designers and analysts to focus on refining their work rather than spending excessive time on technical aspects. Ultimately, AI-powered tools contribute to more innovative, accurate and visually compelling outcomes in both fields 3.
Lastly, the CGI technique, namely the computer-generated imagery is significant to be mentioned as well, since it brought a revolution to brand designing and digital marketing in the last years. CGI is supported by specific AI visualizing tools, like 3D functions and it aims to create lifelike content, which will be attractive and easily memorized by potential buyers. This innovation seeks to establish a new approach to advertisement that combines highly technological computer-generated AI tools with real, human environments, products, and services. This blend of the human aspect with the computational one emerges a pure, dynamic, and creative outcome of transforming data visualization into a message. The apiece message is immediately directed to the audience in a powerful, photorealistic, animated way.
The above technical process of blending the real world’s content with the generated one is characterized as a virtual reality, where both sides coexist and dynamically complement each other. This advanced technology creates an immersive experience that appears highly lifelike and realistic, making it closely aligned with human perception and expectations. As a result, virtual reality significantly enhances the appeal of branding advertisements, making them more engaging and memorable for the target audience. By providing an immersive and visually engaging experience, virtual reality enables brands to attract consumer interest more successfully, eventually enhancing their marketing influence.
References
1 Barth, Paul, The Rise of Data Visualization and Infographics in Design, (2024), Generate Design.
2 Data Visualization: Design Considerations, (2025), Berkeley Library, University of California.
3 Pitonak, Martin, Future of CGI in marketing: trends and predictions, (2024), WELPIX.