English
 Español
 Français
 Deutsch
 Italiano
 Português
The world is awash in data. We even have fresh data about data. It shows that the amount of data available to analysts doubles every two years. Ninety percent of what's available today was generated in the last two years.
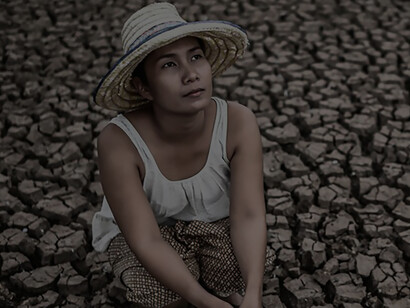
New data and the tools to analyze it are improving our ability to anticipate human impacts on the environment, including the adverse effects of climate change. Not long ago, computer models could project climate change only at global and regional scales. Now, analysts predict global warming's impacts on a community and even neighborhood scale, giving city officials and homeowners the information they need to anticipate what's coming.
Other sophisticated mapping programs reveal where industrial activity threatens sensitive ecological resources and human populations. Exposing these conflicts is the first step to holding the industry accountable.
For example, consider the conflict between fossil energy production, biodiversity, and human settlements. Earth InSight, a project of the Resources Legacy Fund in California, maps the expansion of fossil fuel production in protected areas. It has identified nearly 2,340 active or planned oil, gas, and coal extraction projects in legally protected areas worldwide. The result will be more than three times the annual carbon dioxide emissions from the United States and China combined.
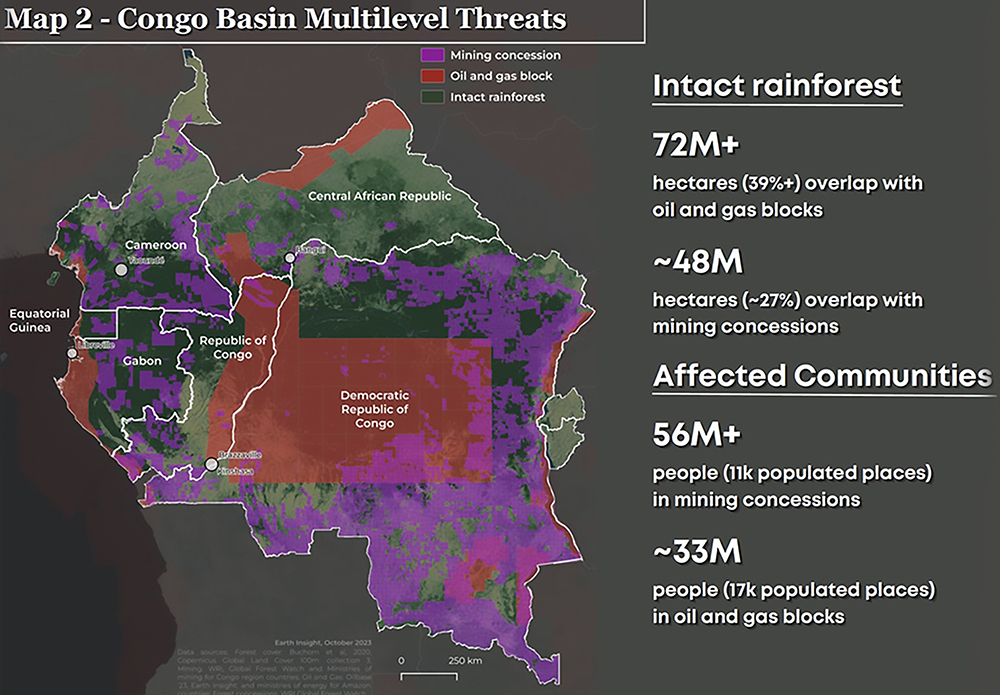 Improved data let us pinpoint environmental conflicts around the World. For example, this map,
developed by the U.S. nonprofit organization Earth Insight, shows fossil energy development in
rainforests and near communities in the Congo. (Source: Earth Insight)
Improved data let us pinpoint environmental conflicts around the World. For example, this map,
developed by the U.S. nonprofit organization Earth Insight, shows fossil energy development in
rainforests and near communities in the Congo. (Source: Earth Insight)
The project pays particular attention to the Congo, the Amazon, and Southeast Asia because of their high levels of biodiversity and ecosystems that contribute to carbon sequestration. In the Congo, 38 percent of protected areas are open to oil and gas production. In the Amazon, oil production is underway or planned in the habitat of more than 700 endangered and listed species.
Earth InSight’s executive director, Tyson Miller, calls these conflicts "symptomatic of a system gone awry." That system extends worldwide, with nations spending $7 trillion in 2022 to subsidize fossil fuel production, according to the International Monetary Fund. The subsidies continue even though eliminating them would prevent 1.6 million people from dying due to air pollution alone.
Today's data help reveal other industries' environmental and human impacts, too. In the United States, the Environmental Working Group, a nonprofit group of scientists, attorneys, and data analysts, publishes interactive maps illustrating everything from toxic algae blooms and water pollution from factory farms to carcinogens in tap water and the use of pesticides near schools and churches.
Better data across issues are leading to more holistic and environmentally just planning. An organization called Geomatico has developed an Environmental Justice Atlas, an interactive world map pinpointing socio-environmental conflicts involving nuclear energy, mining, waste management, land, water, fossil fuels, industry, and threats to biodiversity.
The U.S. government has created a Climate and Economic Justice Screening Tool with an interactive map that identifies communities experiencing problems with climate change, energy, health, legacy pollution, water, and workforce development. It uses the information to target federal grants.
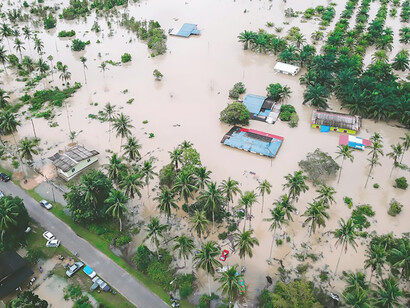
Growing climate risks are spawning new approaches to helping communities prepare. One example is Rebuild by Design, a program created to help U.S. communities recover from Hurricane Sandy, a huge and powerful storm that hit America's mid-Atlantic region in 2012. Rebuild began as a design competition that encouraged innovative approaches to local resilience. It has expanded to work with experts who engage citizens and local governments in resilience planning in more U.S. communities as well as communities in Mexico, Greece, Amman, and Jordan.
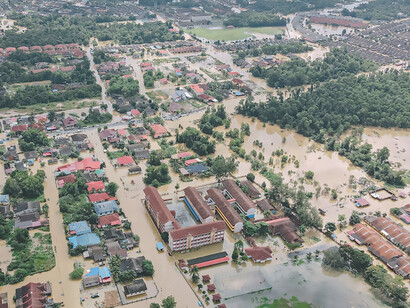
Rebuild has published climate-impact information for America's more than 3,100 counties. It found that 90 percent have experienced a federally declared climate disaster during the decade between 2011 and 2021. Some suffered as many as 25 federal disaster declarations during that time. The risks are growing. Rebuild calculates that floods alone in the U.S. will cost nearly $72 billion over the next decade.
To encourage holistic planning and identify "compounded risks," the program's research cross-fertilizes information about climate-change vulnerability with data on local poverty, housing, energy reliability, infrastructure, and environmental issues.
In another example that enables multi-issue planning, the Environmental Defense Fund and Texas A&M University have published an interactive map of places in the U.S. most vulnerable to fire, floods, and pollution. Based on more than 70,000 census tracts, the map includes information on income levels, access to health care, and other factors that multiply global warming's adverse effects.
Yet another U.S. organization, the First Street Foundation, warns there are few, if any, places to hide from a future of more severe and frequent weather disasters. This will disappoint the cities and regions that thought they would be "climate havens" where global warming would have little effect and bring them new populations and economic development.
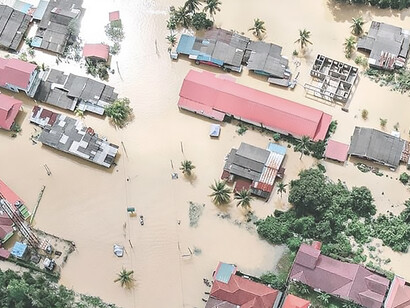
First Street reports that 3.2 million Americans left cities from 2000 to 2020 due to flooding alone. It says this has created urban "abandonment zones" where populations will decline 24 percent in the next 30 years.
First Street has created "Risk Factor," a tool that allows any homeowner, investor, city planner, or insurer to enter a home's address and learn about its vulnerability to floods, wildfires, wind, or heat. The organization estimates that up to 13 million Americans are vulnerable to sea-level rise; wildfires threaten 10 million properties; and 108 million Americans in over 1,000 counties will experience temperatures above 125 degrees Fahrenheit three decades from now.
Last year, First Street reported that 1.3 million people in the United States can expect 100-year flood events at least once every eight to 10 years, and over half of Americans live in places twice as likely to be flooded as previous estimates showed.
The organization's analyses also show that old data have brought the United States to the brink of an economy-wide crisis. Because government agencies and real estate markets greatly underestimate flood dangers, flood-prone real estate is overvalued by as much as $237 billion. The result is "a bubble that threatens the stability of the U.S. housing market... (a) risk carries an enormous cost."
Better data reveal other significant risks. In February, the New York Times published maps showing how the United States mainland is shrinking and sinking, particularly on the Atlantic coast. Sea-level rise is inundating land, while fresh-water withdrawals are causing large areas of the coast to subside, making even more land vulnerable to the ocean.
However, while the wealth of data gives us better insights into what we can expect from climate change and industrial development, experts caution that we should be mindful of its limitations. Dr. Justin S. Mankin, a climate scientist at Dartmouth, points out that profit-making companies can intentionally engineer data to be "difficult or impossible to perceive without special tools or privileges." He argues that data are a public good that businesses should not commodify. Instead, the data and the codes to process it should be fully open so they can be reviewed and validated.
And even the best data run into the human factor, like people who deny climate risks or refuse to do anything about them. To paraphrase the old maxim, you can lead people to data, but you can't make them think.