English
 Español
 Français
 Deutsch
 Italiano
 Português
Of the many differences among populations in a world of eight billion people, one of the most consequential is the longevity divide, i.e., differences in the length of human life.
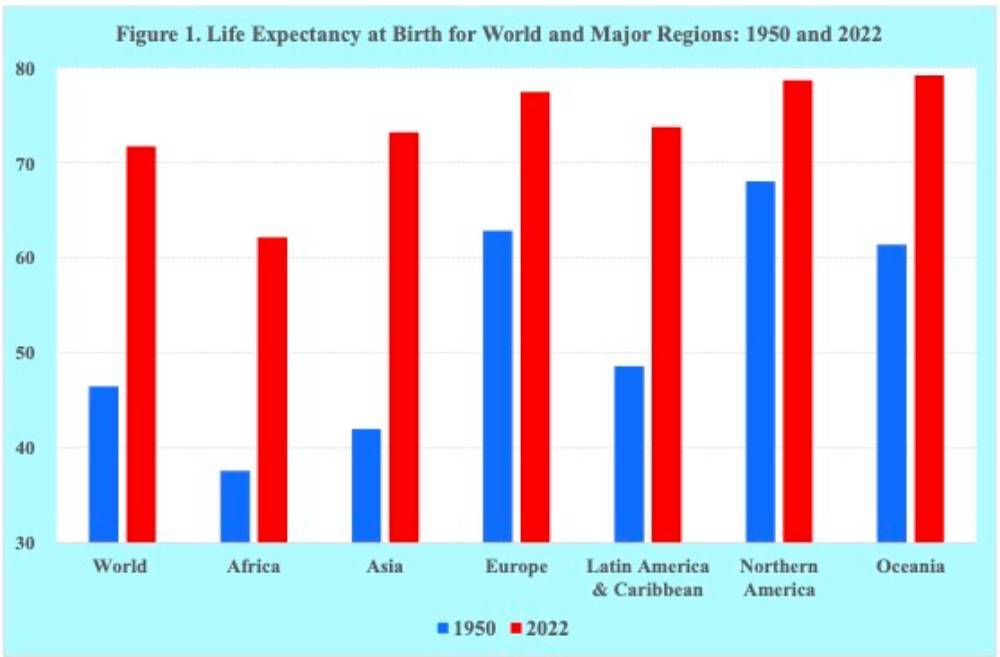
Over the recent past, impressive reductions in mortality levels have been achieved globally. The world’s average life expectancy at birth has increased from 47 years in 1950 to 72 years today. Moreover, the gains in life expectancy have occurred across the major regions of the world, see figure 1.
The improvements in mortality rates have not been limited to the young but have also occurred among the old. The world’s average life expectancies at ages 65 and 80 have increased from 11 and 5 years in 1950 to 17 and 8 years today. And in many countries, such as France, Italy, Japan and Spain, life expectancies at ages 65 and 80 years have reached more than 20 and 10 years, respectively.
Despite the welcomed declines in mortality levels and the impressive gains in life expectancy that have occurred since World War II, worrisome differences in the length of life persist across regions. The difference between the life expectancy at birth in Africa and Europe, for example, is 15 years.
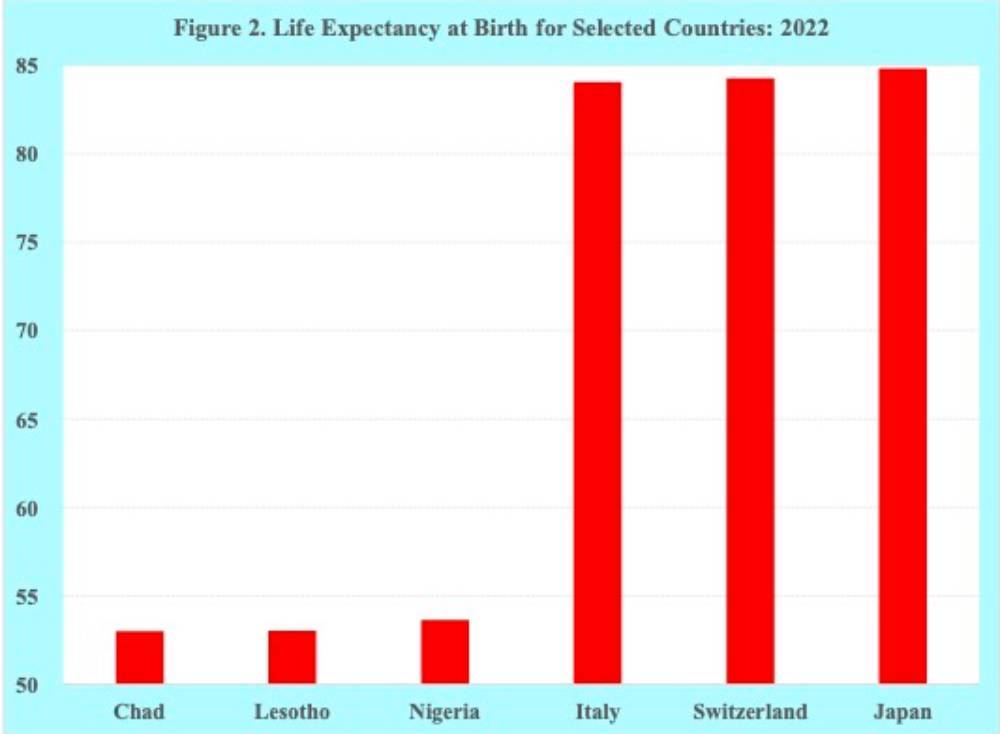
The differences in length of life among countries are even greater. The differences between countries with the highest life expectancy at birth, such as Japan, Switzerland and Italy, and the lowest, such as Chad, Lesotho and Nigeria, exceed 30 years, see figure 2.
The longevity divide is not limited to differences among countries. Significant differences also exist within countries, even the wealthiest such as the United States.
Examining country differences and the likely causes for those disparities may offer some insight into how best to address the longevity divide within countries as well as among countries.
The U.S. has certainly made noteworthy progress in reducing mortality rates. However, differences in the length of life have continued among America’s major racial/ethnic groups as defined by the U.S. Census Bureau. The life expectancies at birth of the five major racial/ethnic groups in 2021 provide a clear indication of the significant disparities in the length of life.
The highest life expectancy at birth of 84 years - eight years more than the national average - is among Asian Americans. At an intermediate level are Hispanic Americans and White Americans at approximately 77 years. The lowest levels of life expectancy are observed among Black Americans and American Indians/Alaska Natives at 71 and 65 years, respectively, see figure 3.
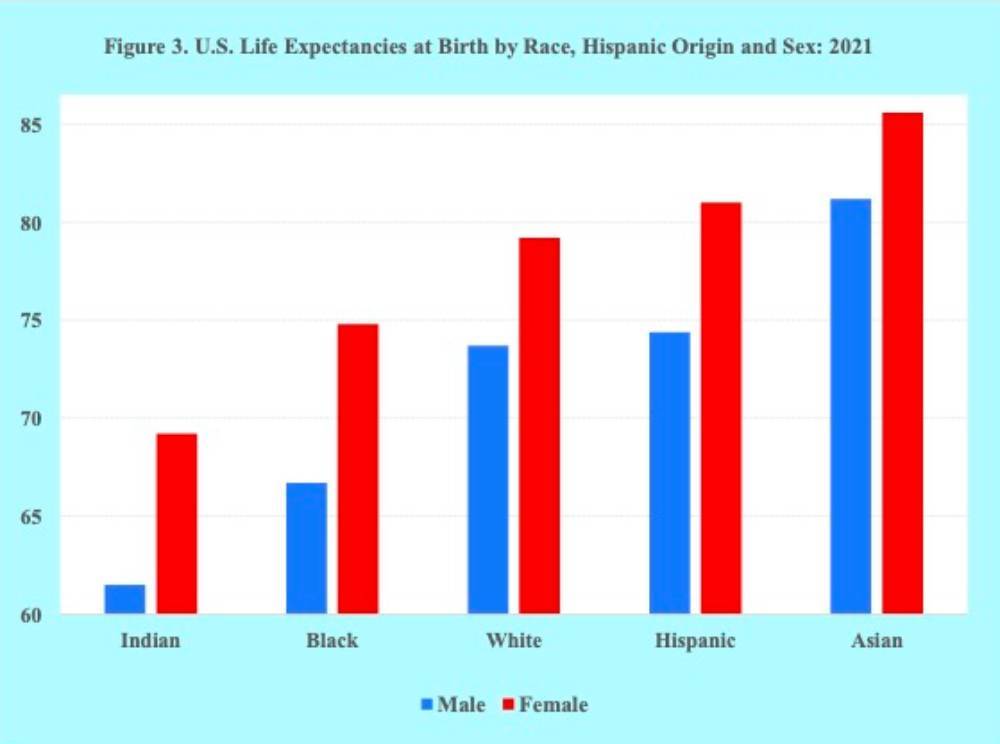
Life expectancies for females are markedly greater than those for males among all of the given groups. The sex differences in life expectancy, however, are greater for Blacks, Indians and Hispanics, at approximately seven to eight years, than for Whites and Asians, at about four to five years.
The disparities in the length of life among the five groups are evident across the entire human age span, starting at birth and continuing well into old age. Whereas the infant mortality rate of Asians is about 3 per 1,000 live births, the rate for Whites and Hispanics is 5, followed by Indians and Blacks at 8 and 11, respectively.
Pregnancy-related maternal mortality also reflects significant differences among America’s racial/ethnic groups. While Asians, Hispanics and Whites have pregnancy-related maternal mortality rates of approximately 13 per 100,000 births, the rates for Indians and Blacks are substantially greater at about 30 and 40, respectively.
At the upper end of the age distribution, the life expectancies of the groups exhibit a similar pattern of disparities. At age 65, for example, Asians are at the top with an average of 22 years of life remaining, followed by Hispanics and Whites with averages of 18 years and Blacks and American Indians of 16 years.
The negative effects of the COVID-19 pandemic on life expectancies also differed among America’s major racial/ethnic groups. Between 2019 and 2021 American Indians experienced the largest decline in life expectancy at birth of nearly seven years, followed by a decline of four years among Blacks and Hispanics. The declines in life expectancy due to COVID-19 among Whites and Asians were significantly less at approximately two years.
While the disparities in the length of life among America’s major racial/ethnic groups are well documented, the causes or reasons for the differences are open to interpretation.
Some emphasize individual behavior, such as smoking, alcohol consumption, drug use, diet, exercise, vaccine hesitancy and general health behavior, to explain group differences in longevity. Others stress the importance of socio-economic determinants, such as income, education, healthcare, housing, neighborhood, pollution and hazardous environment, for disparities in length of life.
And still, others contend that the length of life differences among the groups result from a combination of individual behavior and socioeconomic inequities.
Unhealthy lifestyles interacting with differences in poverty, education, housing and limited access to healthcare are believed to give rise to the substantial disparities observed among America’s major racial/ethnic groups.
To better understand the reasons behind the differences in the length of life, some have recommended examining the behavior and socio-economic characteristics of Asian Americans given that they outlive all other major U.S. groups.
In general, with regard to personal behavior in America, Asians have the lowest rates of smoking, obesity, and illicit substance use. For example, the rate of obesity among Asian adults in 2020 was 12 percent. In contrast, the rates for adults among the other groups were 30 percent for Whites and approximately 40 percent for Blacks, Hispanic and Indians.
Also, the lowest prevalence of physical inactivity outside of work in 2020 was among Asians at 20 percent, closely followed by Whites at 23 percent. The proportion for Blacks, Hispanics and Indians was considerably higher at approximately 30 percent.
With respect to educational attainment, Asian American adults had the highest levels of college degrees. In 2019 the proportion of the Asian American population aged 25 years and older having a bachelor’s degree or higher was 58 percent versus the proportions for Whites, Blacks and Hispanics at 40, 26 and 19 percent, respectively.
Turning to average household income, a similar pattern emerges across the groups. The median household income in 2021 was the highest among Asians at 101 thousand. Whites were next at 78 thousand, followed by Hispanics and Blacks at 58 thousand and 48 thousand, respectively.
In terms of children and family structure, significant disparities are also evident across the groups. The proportion of children in single-parent families in 2019 was the lowest among Asians at 15 percent, followed by Whites at 24 percent. Substantially higher proportions of children in single-parent families were reported for Hispanics, Indians and Blacks at 42, 52 and 64 percent, respectively
Concerning overall health status, the proportions reporting being in “below average health” in 2020 were 8 percent for Asians and 13 percent for Whites. They were followed by Hispanics, Blacks and Indians with proportions of 16, 19 and 22 percent, respectively.
Those health status rankings among the groups were consistent with their access to healthcare. Although the 2010 Affordable Healthcare Act narrowed differences in healthcare access, the uninsured rates in 2019 for the nonelderly U.S. population remained the highest for American Indians and Hispanics at 22 and 20 percent, respectively, followed by Blacks at 11 percent. The lowest uninsured rates of 7 and 8 percent were reported for Asians and Whites, respectively.
In sum, despite the remarkable progress in reducing morbidity and mortality levels among countries as well as within them, significant disparities in the length of life persist. To further reduce those sizable differences in length of life, improved policies and strengthened programs are needed to address individual behavior as well as the socio-economic determinants bringing about the worrisome longevity divide.